- March 9, 2023
Re-imagining Group decline rates *
Introduction
Azuria Partners have prepared a short note examining the Life Insurance industry claim decline rates from June 2018 to June 2020 using biannual APRA Life Insurance Claims and Disputes statistics¹. This is the total duration of the available time-series. Our aim is to examine whether there has been any noticeable change in life insurer decline rates since the Royal Commission into Misconduct in the Banking, Superannuation and Financial Services Industry during 2018.
In summary we have observed that DII and Death remained relatively stable across the time periods examined while TPD decline rates have materially reduced. TPD experienced higher volatility in this decline rate time-series.
The first reporting period from 2018 represents July-2017 up to June-2018 reported claims, so we now have three complete years of reporting of the claim decline rates. The decline rates are measured by number of claims.
Group Insurance in Superannuation: Decline rates
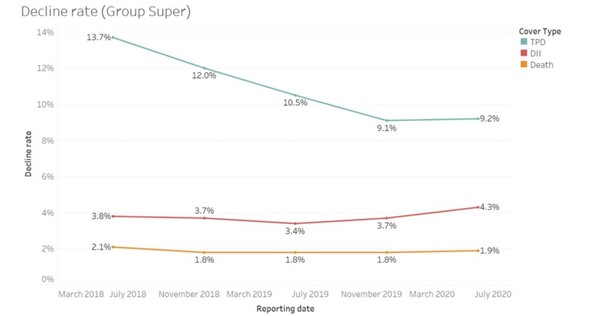
The graph below shows a time series of the overall decline rate of Group Super products split by cover type. The results are summarised in Table 1.
Table 1: Key Observations of decline rates across 2018-2020 period, Group Superannuation
TPD | DII | Death | |
Average decline rate across full year period | 10.9% | 3.8% | 1.9% |
Trend | Material reduction from 13.7% (FY18) to 9.2% (FY20). | Flat / no trend | Flat / no trend |
It is notable that there is a clear trend of reduction in TPD decline rates, with TPD decline rate dropping by 4.5% across the three year period under investigation.
Graph 1: Group Super decline rates
Group Insurance Ordinary: Decline rates
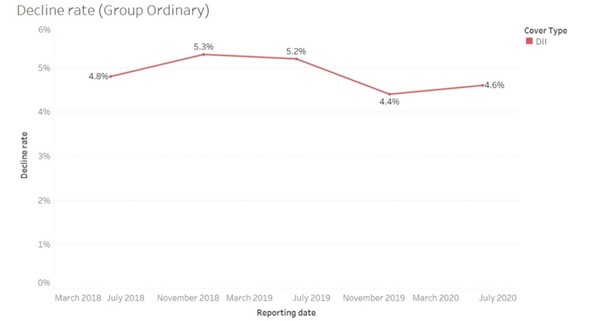
The following graph is as above except for Group Ordinary products. For lump sum products (Death and TPD) there are only a small number of reported claims and therefore we omitted the analysis of the Death, TPD results as they are not statistically credible.
Table 2: Key Observations of decline rates across 2018-2020 period, Group Ordinary
DII | |
Average decline rate across full year period | 4.9% |
Trend | Flat / no trend |
Interestingly, the decline rate for Group DII (Ordinary) is 1% higher than the corresponding decline rate in the superannuation environment.
Graph 2: Group Ordinary decline rates
Key considerations
TPD Decline rate reduction – Group Super
Noting that the TPD decline rate has dropped materially by 4.5% across FY19 and FY20, this indicates material implications for life insurance pricing. Usually when determining adjusted loss ratio observations, for inputting into the assumption selection process, pricing actuaries will rescale past observed loss ratios to capture trends that have permanently changed since the underlying observations.
The rescale factor for TPD decline rate needs to be carefully determined because as we have seen from the Industry statistics, there appears to be a solid underlying trend of reduction in decline rate. Additionally, it is noted that the change in TPD decline rates is not an impact that is connected to an incurred claims time period, but rather an impact that is connected to a reported claims time period.
The stylised chain ladder below shows how the decline rate would appear for each cell of the chain ladder, according to the decline rate observations that we can see from 2018-2020.
Table 2: Sample TPD chain ladder / decline rates.
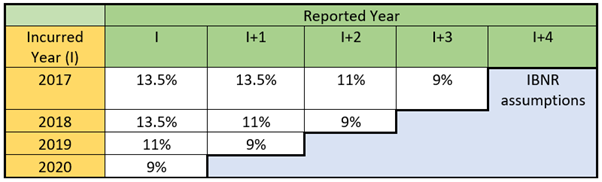
Assuming that the IBNR assumption is derived correctly using the most recent decline rate (9%), the Reported claim loss ratios for earlier incurred years of TPD may need to be adjusted upwards, possibly by as much as 5% (91%/86.5% = +5.2%), to capture what appears to reflect an industry sector shift in the standards of TPD claims assessment.
Conclusion
TPD decline rates for insurance in superannuation have materially reduced after FY18. This could suggest material implications for the pricing of group life & TPD insurance arrangements inside superannuation.