- March 23, 2023
Income growth over the past 15-years - differences in population segments and implications for life insurers *
Introduction
Reports of low income growth have gained traction in mainstream media and economists as of late. Low income growth predates the COVID-19 pandemic, with ABS statistics highlighting the decline in wage growth post Global Financial Crisis (GFC), from a high of 3.9% in the year ending Dec 2010 to 1.4% in the year ending Dec 2020¹. While headline income growth has declined overall, segments of the population have seen larger declines relative to others.
The article will explore differences in wage growth across the population segments below, considering the implications for life insurers for each:
- Public v Private sectors
- Industry
- Income decile
The article draws on ABS data, Productivity Commission analysis and analysis commissioned by the Australian Treasury.
Public sector v Private sector
In 2020, Federal and State governments announced wage freezes as a result of COVID-19², with many private workplaces following suit – however,
How has wage growth in the public and private sectors compared over time?
The Wage Price Index (WPI), captured by the ABS, measures the change in the price of labour based on a sample of 18,000 job occupants.³
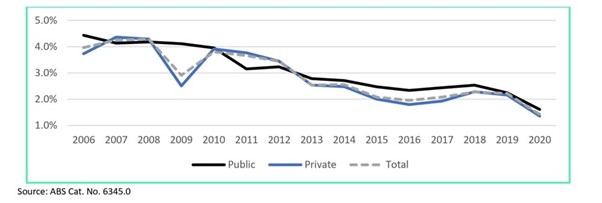
The WPI reveals the following insights:
-
WPI has trended downwards for both the public and private sectors since 2006.
-
Private wage growth dipped in 2009, following the peak of the GFC.
-
Public wage growth was higher than private from 2013 to 2018, though the growth rates converged from 2019.
-
Overall, there has been a strong correlation between public and private sectors – both sectors have experienced declines in wage growth.
Chart 1. Annualised growth in WPI for the year ending December, for Public sector, Private sector and Total
The diagram below illustrates a selection of new concepts arising from draft SPS250. Key updates include requirements upon RSE Licensee to understand their membership, and to ensure that the insurance strategy is appropriately designed for the various membership cohorts.
Implications for Life Insurers – Sum Insured Indexation Option
Current life insurance policy design does not allow for indexation linked to wage growth, only indexation linked to the Consumer Price Index (CPI) is allowed for instead. Sum insured indexation is a common option across the range of life insurance products, including Death, TPD, Trauma and IP covers. The purpose of the option is to account for inflation, to “future-proof” the policy in line with changes in cost-of-living.
For lump sum products, the option generally increases the sum insured on an annual basis by the higher of 5% or CPI. However, with historical CPI fluctuating between 1 – 3.5%⁴ with a decreasing trend, this suggests that those with the option have historically had their sum insured amounts increased by the higher 5%.
With the difference between historical CPI and the 5%, how appropriate is the existing sum insured indexation option design for customers in a low wage growth environment?
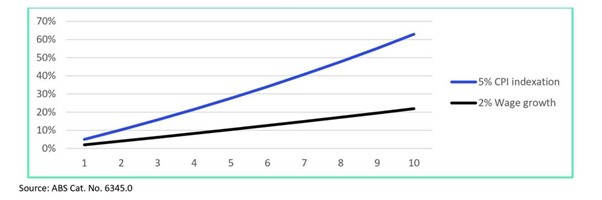
With the cost of additional insurance cover (5% from the indexation option) exceeding wage growth (see Chart 1), there is increased pressure on premium affordability. To illustrate, see below the impact of a 5% increase compounded over 10 years compared to a 2% increase. Over 10 years, the impact translates into a 34% gap.
Chart 2. Compounding impact of CPI increases vs Wage growth over time
Claims benefit indexation option
Claims indexation on income protection products generally provides claimants increasing benefits at the minimum of CPI and 3%. While there is narrower gap between CPI and wage growth, there remains a risk that in a low wage growth environment, claimants may be disincentivised from returning to work if claim benefit increases are higher than they would have received while employed.
Industry
While wage growth has declined overall post-GFC, a number of industries have experienced higher wage growth relative to others. Analysis of wage growth over an 11-year period from 2009-20 reveals the following:
Cumulative growth over 11 years | Annualised | |
Electricity, gas, water and waste services | 40.2% | 3.1% |
Health care and social assistance | 38.4% | 3.0% |
Education and training | 38.0% | 3.0% |
Financial and insurance services | 35.4% | 2.8% |
Public administration and safety | 35.1% | 2.8% |
Arts and recreation services | 35.1% | 2.8% |
Mining | 34.0% | 2.7% |
Transport, postal and warehousing | 34.0% | 2.7% |
Manufacturing | 33.4% | 2.7% |
Wholesale trade | 32.5% | 2.6% |
Construction | 32.3% | 2.6% |
Professional, scientific and technical services | 31.8% | 2.5% |
Accommodation and food services | 31.1% | 2.5% |
Information media and telecommunications | 29.6% | 2.4% |
Retail trade | 29.2% | 2.4% |
Rental, hiring and real estate services | 29.1% | 2.3% |
Administrative and support services | 28.5% | 2.3% |
The top-3 industries with highest wage growth experienced annualised growth rates over 3% while the bottom-4 industries experienced growth rates less than 2.5%. Reasons for the polarisation of wage growth include the displacement of routine tasks due to technology, larger wage growth for high-skill jobs relative to middle and low skill jobs, advancement of technology (outsourcing and automation) and emergence of online platform labour matching services (eg Uber, Airtasker, Deliveroo).⁵
Entering 2021, COVID-19 has reshaped the economic environment. With some industries heavily impacted, such as tourism and travel, the resulting wage growth skewness across industry segments should continue to be closely monitored.
Implications for Life Insurers – Group insurance and economic risk
Economic risk may vary between specific industries because of low wage growth. Group insurers with increased exposure to specific industry sectors and occupation types may be at higher risk. Group benefit designs with default income protection can be monitored to understand how replacement ratios may be impacted at industry segment levels.
Income decile
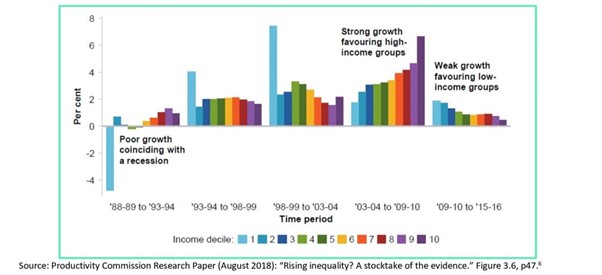
Incomes have varied over time across income groups, influenced by regulation and economic events. Key insights include:
-
Periods of strong economic growth, from 2003-04 to 2009-10 have favoured those with higher incomes, while those with lower incomes have seen lower growth. Difference ranges from 4%+ for higher deciles, down to 2% for lowest decile.
-
Periods of weak economic growth, such as 2009-10 to 2015-16 has tended to favour lower incomes (lowest decile at 2%, higher deciles <1%). Note that from 1988-89 to 1993-94, while the lowest decile experienced negative growth, the lowest decile also experienced the highest growth from 1993-94 to 2003-04.
-
Changes in wage growth for the lowest income decile are heavily linked to legislated income tax changes, minimum wage and social security increases.
Chart 3. Average annual growth rates in equivalised disposable income by time period and income decile
Implications for Life Insurers – Income Protection Product Design
With agreed value policies being replaced by indemnity from October 2021⁷, sums insured (monthly benefit) will be directly linked to changes in income. Combined with wage growth uncertainty given Covid-19, it is increasingly important for life insurers to understand the impact of shifts in policyholder incomes on their Income Protection portfolio exposure.
APRA has restricted income protection policies to limit the benefit amount to 75% or a maximum of $30k per month⁸. Traditionally, maximum monthly benefit limits were calculated using a ladder of different replacement ratios, with a lower percentage applied to the higher part of incomes. However, income growth patterns have changed materially since the ladder of ratios was created.
There is significant uncertainty in the future economic environment. While lower income deciles experienced higher growth over the past 10 years, the trend over the next 10 years is uncertain. In this environment it becomes more important for insurers to understand the earning status of their customers. The ladder of ratios should be reviewed more frequently and proactively, instead of a ‘set-and-forget’ approach.
Footnotes
¹ https://www.abs.gov.au/statistics/economy/price-indexes-and-inflation/wage-price-index-australia/dec-2020
² https://ministers.pmc.gov.au/morton/2020/commonwealth-freezes-wage-increases-public-servants; https://www.governmentnews.com.au/nsw-budget-to-cut-public-sector-wage-increases/
³ https://www.abs.gov.au/methodologies/wage-price-index-australia-methodology/dec-2020
⁴ https://www.abs.gov.au/statistics/economy/price-indexes-and-inflation/consumer-price-index-australia/latest-release
⁵ Australia Treasury, “Analysis of Wage Growth” (2017), at: https://treasury.gov.au/sites/default/files/2019-03/p2017-t237966.pdf
⁶ Productivity Commission estimates using: ABS (Microdata: Household Expenditure, Income and Housing, 2015-16, Cat. no. 6540.0, released 25/10/17) and ABS HES Basic confidentialised unit record files for years 1988-89 through 2009-10 as available at 25/10/17
⁷ https://www.apra.gov.au/final-individual-disability-income-insurance-sustainability-measures
⁸ https://www.apra.gov.au/final-individual-disability-income-insurance-sustainability-measures