- July 11, 2023
Risk Products Performance | Analysis of APRA Statistics
Maria Hadinata
July 2023
APRA releases life insurance industry performance statistics on a quarterly basis¹. Latest release shows that the industry reported net profit after tax of $0.5 billion for 2022 and $0.7 billion for 2023Q1, with Risk Products² specifically reporting $1.0 billion and $0.3 billion respectively over the same period.
This article provides observed trends and potential drivers of profitability for Risk Products from 2018 to 2023Q1. Various factors can impact reported profitability, whether inside or outside the control of life insurers.
This article explores the specific correlation between recent macroeconomic factors and profitability while also commenting on the observed trends.
The key analyses performed are as follows:
- Correlation trend between interest rate movement and reported profitability
For profitability reporting purposes, the life insurers need to measure:
- actual cashflows, and
- movement in the organisation’s assets and liabilities.
Macroeconomic factors including interest rates are key assumptions in determining the value of assets and liabilities.
Fluctuations in interest rates will impact reported profitability, depending on the insurers’ position on asset and liability matching.
- Asset and liability matching position
The assets and liabilities profile held by life insurers for each risk products were analysed in this article. Mismatches between assets and liabilities could potentially impact the reported profits.
- Trend of profitability breakdown for each risk products
This article observes the movement between investment income and changes in policy liabilities in correlation to interest rates environment – and its impact on reported profitability.
Additionally, it discusses the potential impact of regulatory changes in the Group Business space on net policy expenses.
1. Latest Risk Products Performance Statistics
The following chart shows profit or loss before tax by each risk product.
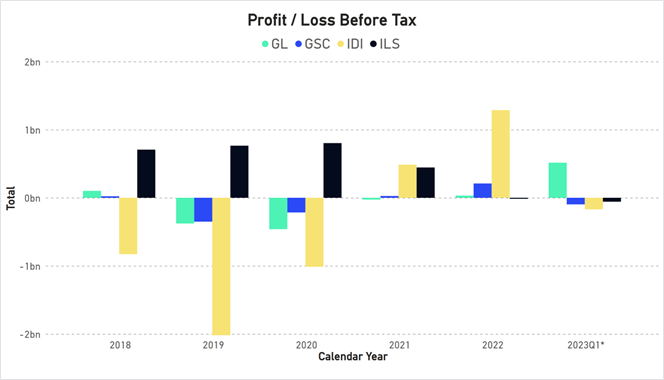
Figure 1
*The number reported for 2023Q1 is for the quarter ending 31 March 2023.
It can be observed that over the period from 2018 to 2023Q1, risk products within the life insurance industry experienced varying levels of profitability.
Losses were observed for Individual Disability Income Insurance (IDI), Group Lum Sum Risk (GL), and Group Disability Income Insurance (GSC) from 2018 to 2020, with IDI experiencing significant losses during this period.
However, there was a positive change in performance in 2021 for these products. Individual Lump Sum Risk (ILS) has almost consistently reported profits throughout the years, although there was a slight decline in profitability over the past two years.
2. Interest Rates and Impacts on Reported Profitability
Life insurance reported profit can be expressed as the difference between:
revenue = premiums + investment income
less
expenditure = claims + expenses + change in policy liabilities + tax
Reported profit in life insurance operations reflects not only actual cashflows amounts, but also the fluctuations in the value of assets (investment income) and the changes in policy liabilities.
The valuation of these elements is influenced by interest rates.
2.1 Observed Movement in Cash Rates and Reported Profitability
Over the past five years, there have been notable changes in cash rates (Figure 2). We observed low and decreasing rates during 2018 to early 2021.
However, in late 2021 and 2022, there was a noticeable shift in the trajectory of cash rates, with a steep and continuous monthly increase as per the Reserve Bank of Australia’s (RBA) setting of the cash rate target.
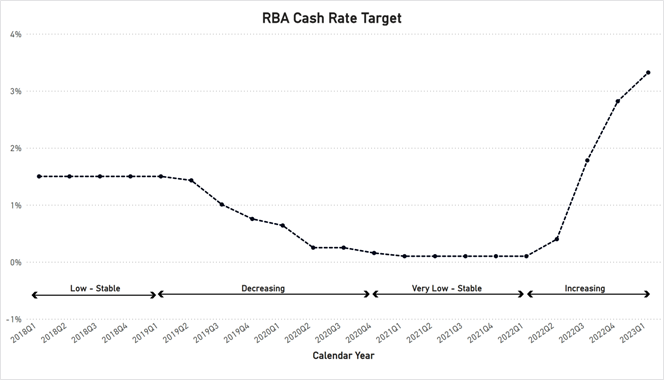
Figure 2
The following table presents the profitability of each risk product over the past five years, along with the corresponding interest rate environment.
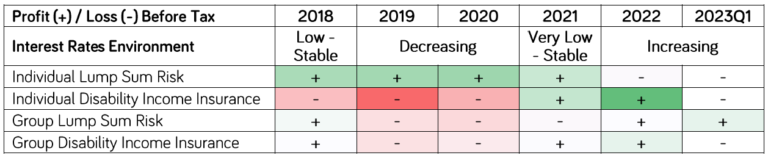
Table 1
As shown in the above table, during the low and decreasing interest rate period of 2018 to 2020, only ILS consistently reported positive profitability. IDI reported significant losses for all three years, and most adversely in 2019 (-$2.0 billion before tax).
During 2021 to 2022, while increasing interest rates are observed, improvement in reported profitability is observed for IDI, most favourable in 2022 (+$1.3 billion before tax). Improved profitability was also reported for GL and GSC, while negative profits were reported for ILS in 2022 and 2023Q1.
One of the contributing factors to the varying profitability among these four risk products is their distinct asset and liability profiles. The movement in interest rates affects the value of assets and liabilities differently for each product. This will be further explained in the next section.
2.2 General Assets and Liabilities Profile
Life insurers invest premiums from policyholders in various assets. Latest APRA release shows that debt securities make up almost 60% of Total Assets (Figure 3) for the whole industry.
The asset breakdown is not released separately for Risk Products – the proportion of debt securities is likely to be even higher for IDI and GSC products.
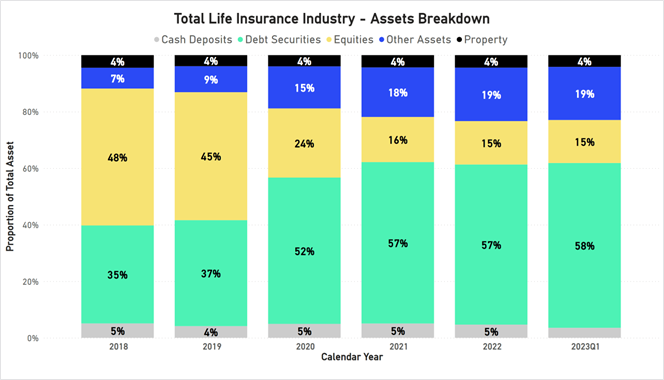
Figure 3
Interest rate fluctuations impact the value of debt securities, leading to gains or losses recorded as “Investment Income” in the Profit or Loss Statement.
Risk Products’ policy liabilities consist of Present Value of Expected Future Cashflows and Expected Future Profit Margins. These cashflows can be categorised by relevance to either past events or future events. Those related to past claims, are generally the Incurred but Not Reported (IBNR), Reported but Not Admitted (RBNA), and Disabled Lives Reserves (DLR).
Separately, there are expected future premiums, claims and profit margins. The calculation of present values involves the use of interest rates. Therefore, fluctuations in interest rates can have a significant impact on the policy liabilities, which is reflected in the reported profit under the line item “Change in Policy Liabilities”.
The following figure shows an illustration of policy liabilities profiles for each risk product.
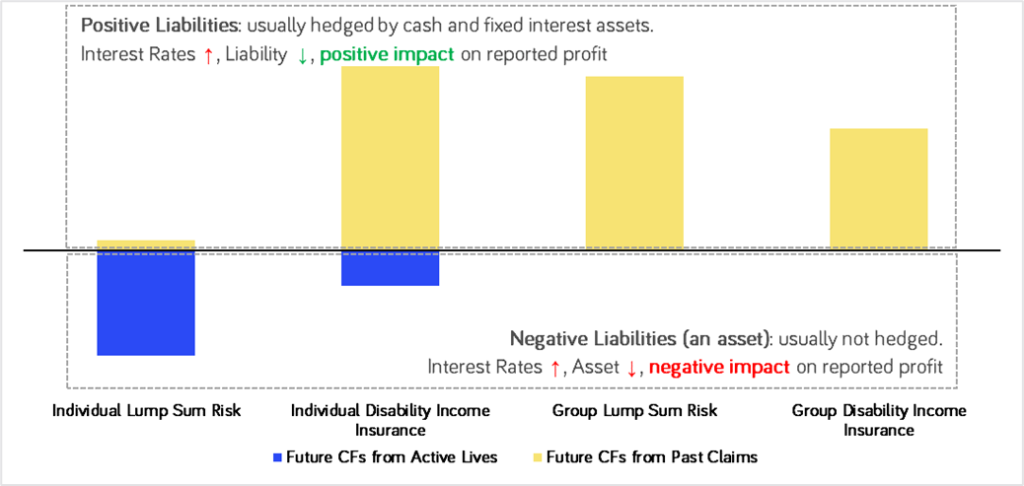
Figure 4
The positive liability component is the reserve for past claims, IBNR, RBNA, and DLR. The past-claim reserves are usually hedged by cash and fixed interest assets (debt securities) of similar durations. In practice, a perfect match is usually not possible due to several reasons:
- Assets class availability: Limited assets in the market that perfectly match the duration and amount required to align with the liability profile of risk products.
- Cost of investment: Acquiring specific assets to perfectly match liabilities can be costly.
- Valuation method and interest rates: The valuation of assets and liabilities may differ, particularly in terms of the interest rates used to value assets and liabilities.
Hence, when interest rates increase, the gain from liability reduction is not matching exactly the loss from asset reduction, impacting reported profit, and vice versa.
The negative liability component represents expected cashflows from Active Lives i.e., an asset. This is usually not hedged. Therefore, when interest rates increase, the asset value reduces and resulting in reported losses, and vice versa.
Risk Products have different liability profiles. For ILS, a significant portion of its liabilities consists of negative liabilities (assets) that are not hedged against interest rate fluctuations.
On the other hand, IDI has substantial portion of positive liabilities due to the past claims’ reserves, with potentially smaller negative liabilities as IDI has reported losses in recent years. Given the long duration of the positive liabilities in IDI, which are generally hedged with debt securities, there may be an expected mismatch between assets and liabilities.
For Group Business, the liabilities usually consist positive liabilities only with shorter duration as compared to Individual Business, resulting in a potentially reduced asset-liability mismatch.
3. Deep Dive of Risk Business Performance
The subsequent sections explore some of the potential profitability drivers by providing breakdowns of the reported profit or loss before tax for each risk product, presented as a percentage of Net Policy Revenue.
3.1 Individual and Group Lump Sum Risk Products
The following chart shows profit or loss before tax breakdown for ILS.
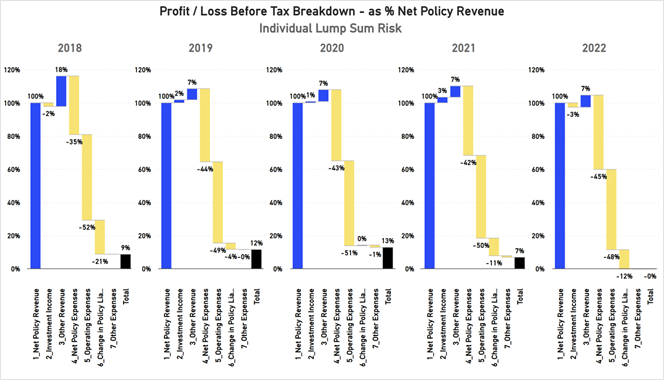
Figure 5
Over the years, ILS products have consistently reported profits, although there has been a slight reduction in profitability in 2021 and 2022 (Figure 5). One potential driver for this reduction is the fact that ILS liabilities mainly consist of negative liabilities (assets) that are not hedged by investments.
As interest rates increase during these periods, the value of assets decreases, resulting in slight reduction in profitability for ILS. However, it is important to note that changes in policy liabilities can be influenced by various factors, including new business volume and acquisition cost, portfolio experience, and other assumption changes.
The following chart shows profit or loss before tax breakdown for GL.
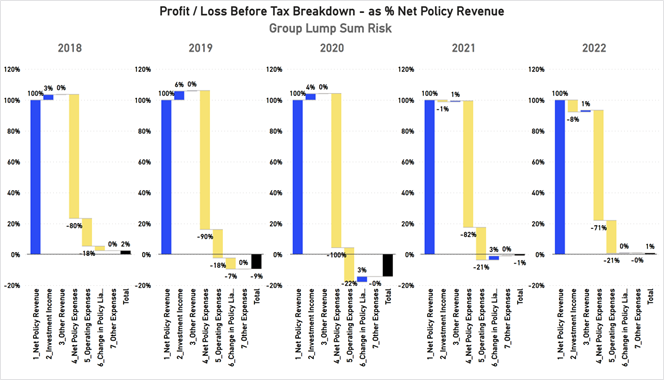
Figure 6
The volatility of reported profits for GL products from 2018 to 2022 can be primarily attributed to fluctuations in Net Policy Expenses (Figure 6). These fluctuations occurred during the implementation of the Protecting Your Super (PYS) and Putting Members Interest First (PMIF) legislations.
During the period of 2019 and 2020, higher Net Policy Expenses percentages were observed potentially driven by anti-selective claims and reduced Net Policy Revenue. Decreasing Net Policy Expenses percentage was observed after 2020 which can be attributed to stabilisation of the sector post regulatory changes and some uplift in premium rates.
No significant trend was observed regarding the relationship between changes in interest rates and effect on liabilities and assets valuations for GL products.
3.2 Individual and Group Disability Income Insurance Products
The following chart shows profit or loss before tax breakdown for IDI.
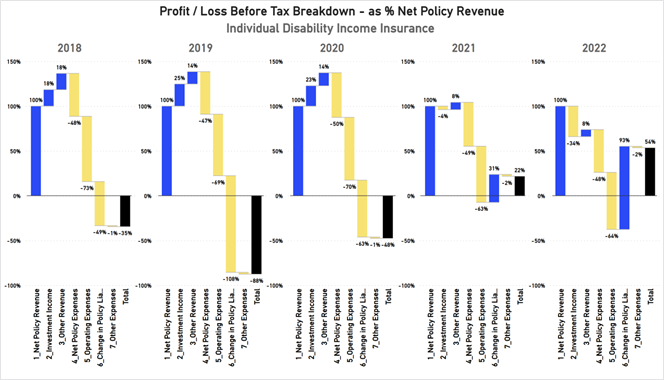
Figure 7
The reported profits of IDI have experienced significant fluctuations over the period from 2018 to 2022 (Figure 7). These fluctuations included substantial losses from 2018 to 2020, followed by positive reported profits in 2021 and 2022. One potential driver of these fluctuations is offsetting changes in Investment Income and Change in Policy Liabilities.
During the low and decreasing interest rate environment of 2018 to 2020, there was some positive gain reflected in Investment Income. However, this was outweighed by the increasing Policy Liabilities, resulting in significant negative reported profit. In contrast, during the increasing interest rate environment of 2021 and 2022, IDI reported positive profits. These profits were primarily driven by the release of large reserves (decrease in Policy Liabilities) which are slightly offset by Investment Income.
The following chart shows profit or loss before tax breakdown for GSC.
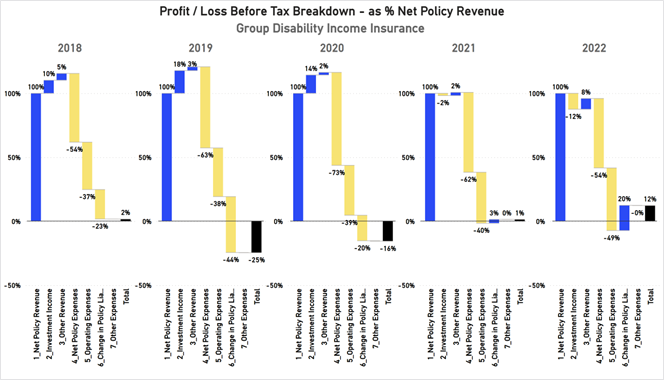
Figure 8
A similar pattern can be observed for GSC, although on a smaller scale as compared to IDI (Figure 8). This could be attributed to the shorter-term nature of GSC liabilities compared to IDI liabilities. The volatility in GSC’s reported profits is also influenced by fluctuations in Net Policy Expenses. Notably, these fluctuations coincide with the PYS and PMIF regulatory changes period (same observations as GL).
4. Conclusion
This article takes a deeper dive into the relationship between risk products’ reported profits, interest rate movements, and asset-liability mismatches faced by life insurers.
Risk products profitability has exhibited volatility from 2018 to 2023Q1. One of the key contributing factors to this volatility is the significant movement in interest rates, which has had an impact on Investment Income and Changes in Policy Liabilities, subsequently affecting reported profits.
In the case of Individual Business, during periods of low and decreasing interest rates, only ILS consistently reported profits. Conversely, IDI experienced significant losses, likely accentuated by a misalignment in the movement of Investment Income and Changes in Policy Liabilities. As the interest rates began to rise, ILS witnessed a decline in profitability, while IDI started to shift towards profitability. These fluctuations can be attributed to the potential mismatches between liability profiles of these products and the assets held by life insurers.
For Group Business, both GL and GSC reported some losses from 2018 to 2020 and started to report some profits from 2021 onwards. This timeframe coincides with the implementation of the PYS/PMIF legislations, which may have contributed to higher claims cost associated with anti-selection and lower premium income. The asset-liability matching effect may also be present for GL and GSC but to a lesser extent compared to the Individual Business, mainly due to shorter liability duration.
Footnotes:
- https://www.apra.gov.au/quarterly-life-insurance-performance-statistics
- Risk Products include Individual Lump Sum Risk, Individual Disability Income Insurance, Group Lump Sum Risk, and Group Disability Income Insurance.
For any questions about this research, please feel free to contact Maria Hadinata on 0423 487 947 or maria@azuria.partners